At the end of October, Vladimir Putin and his special envoy for investment and economic cooperation with foreign countries, Kirill Dmitriev, proposed that the United States increase purchases of Russian fertilizers. The American market for Russian fertilizers has long been open, and the United States is already one of the largest buyers of Russian products. Why has ordinary commercial trade needed to be turned into a subject of political negotiations?
Extraction of potash fertilizers. Photo: uralkali.com
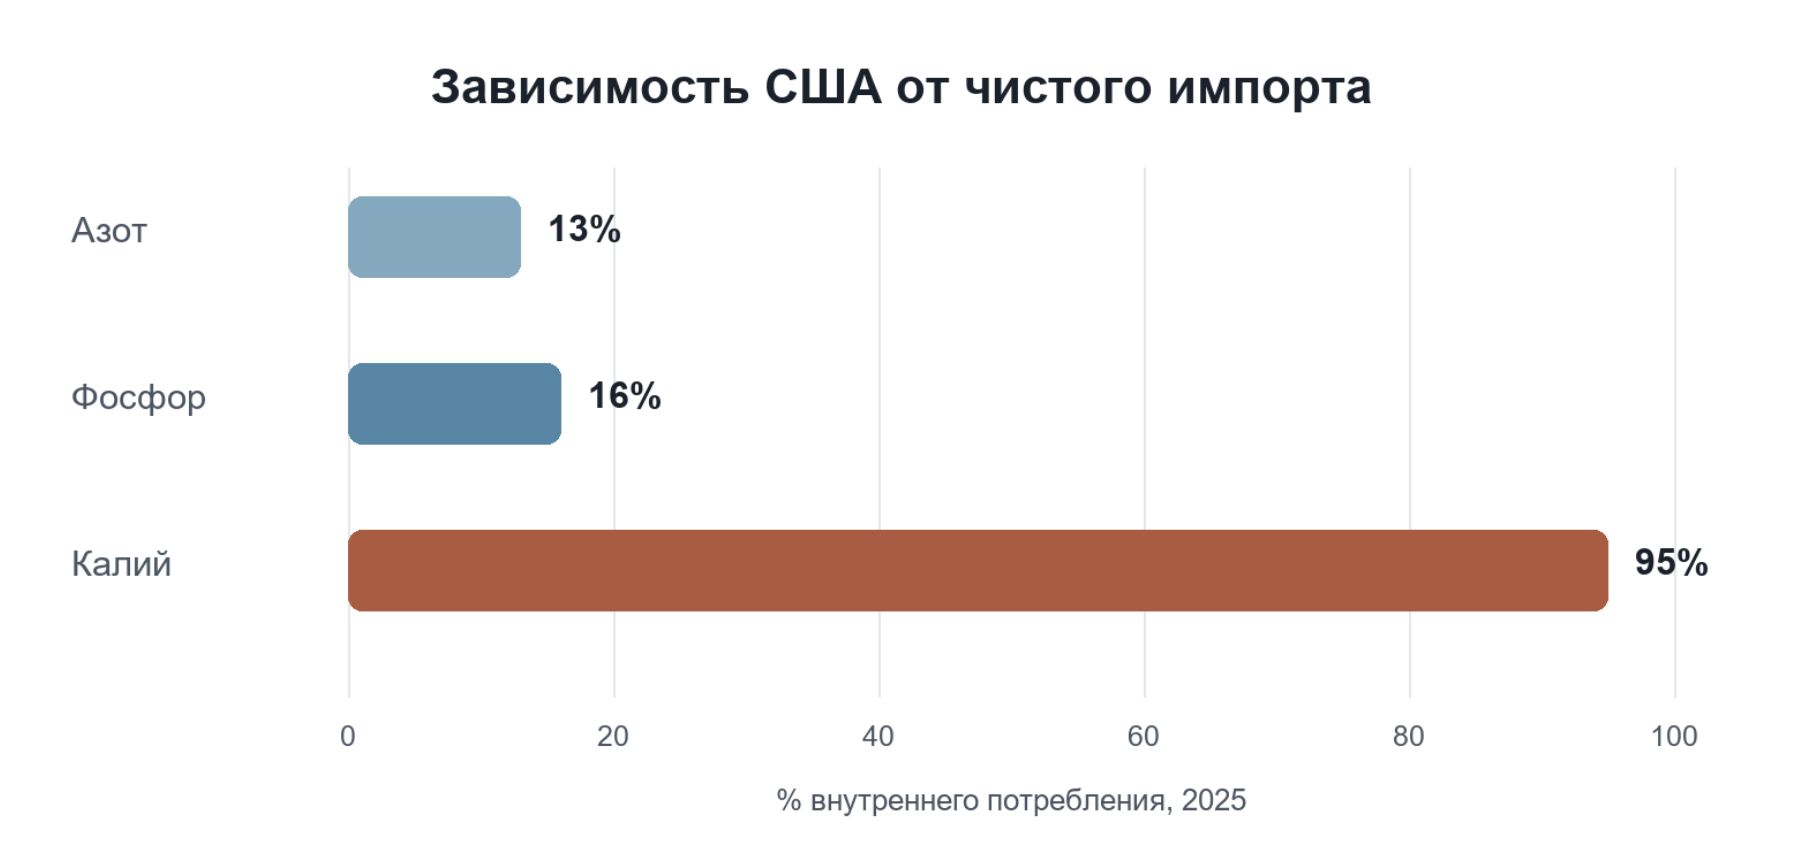
American agriculture consumes enormous amounts of fertilizers, but dependence on imports varies greatly by type. The United States supplies most of its nitrogen and phosphorus fertilizer needs domestically. According to estimates for 2025, net imports cover about 13% of nitrogen consumption and 16% of phosphorus consumption. Potash is a completely different story: roughly 95% of U.S. needs are met through imports. Canada remains the main supplier, thanks to its large production capacity and geographic advantage.
Chart 1. U.S. dependence on net imports by nutrient, 2025 Source: Purdue University Center for Commercial Agriculture, 2026 Scope: net import dependence by nutrient; the indicator does not reflect Russia’s share and is not equal to the share of gross imports.
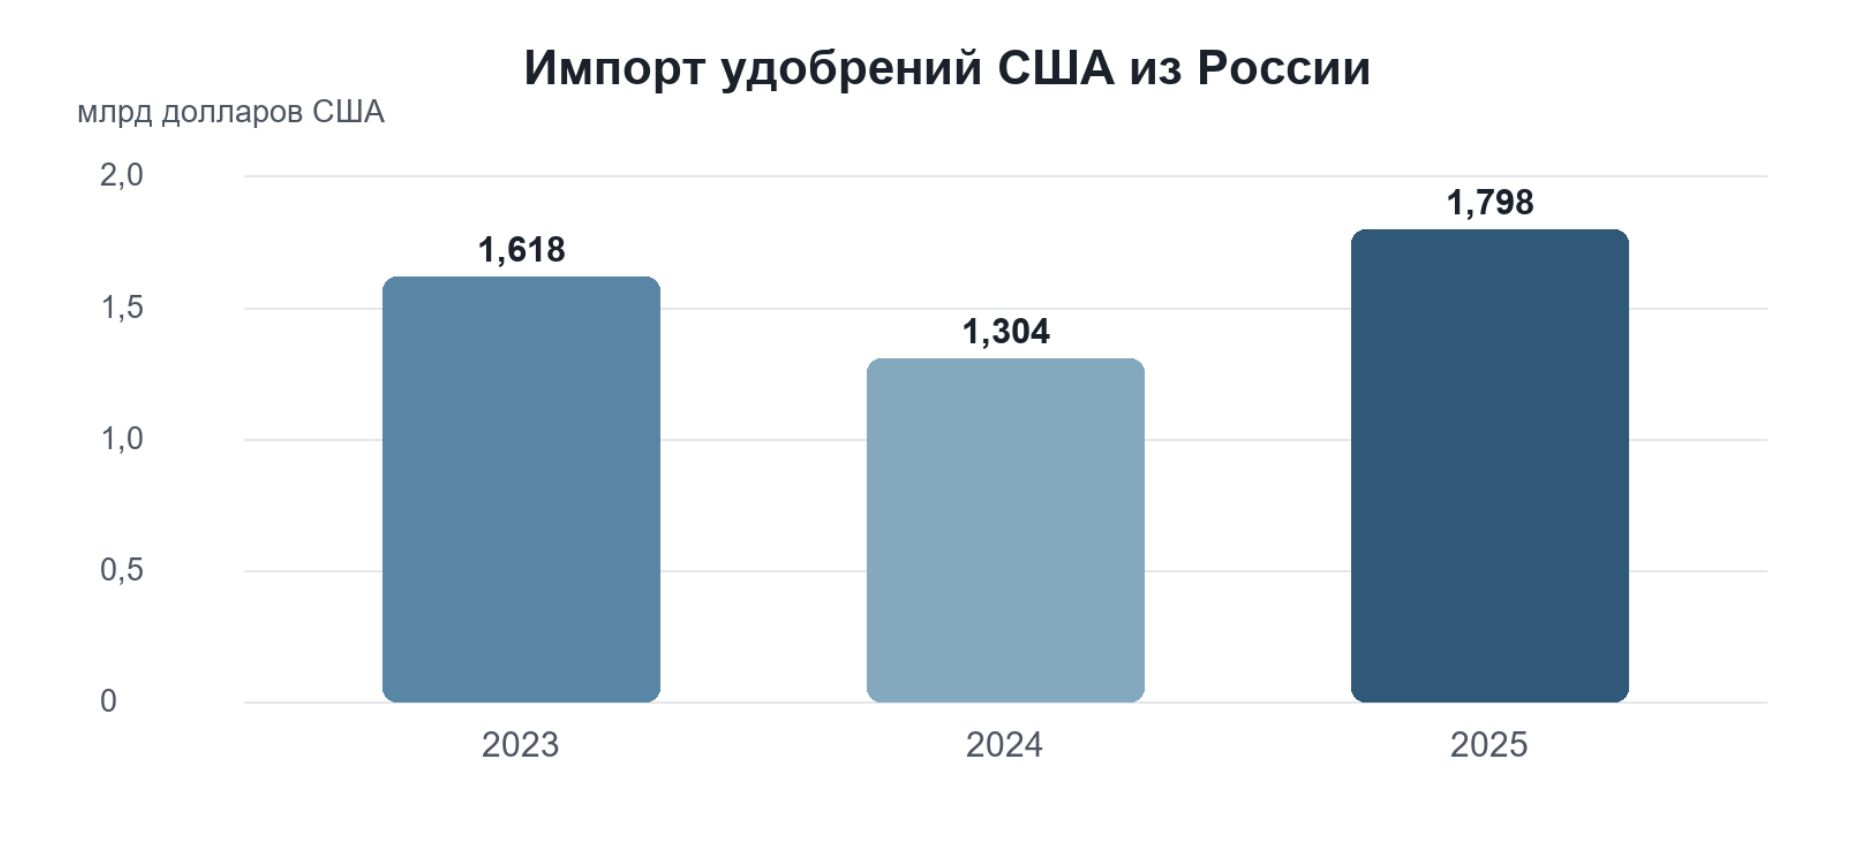
Russia already occupies a very noticeable place in this market. In 2023, U.S. imports of Russian fertilizers amounted to $1.62 billion; in 2024, they fell to $1.30 billion; and in 2025, they rose to $1.80 billion. Russia’s share of U.S. fertilizer imports increased from 13.9% in 2024 to about 20% in 2025. Russia became the second-largest supplier of fertilizers to the United States by value after Canada.
Chart 2. U.S. imports of fertilizers from Russia in 2023–2025 Source: UN Comtrade via World Integrated Trade Solution (WITS), HS 31 commodity group; values rounded to $1.618, $1.304, and $1.798 billion Scope: value of all U.S. fertilizer imports from Russia in current U.S. dollars; all HS 31 categories.
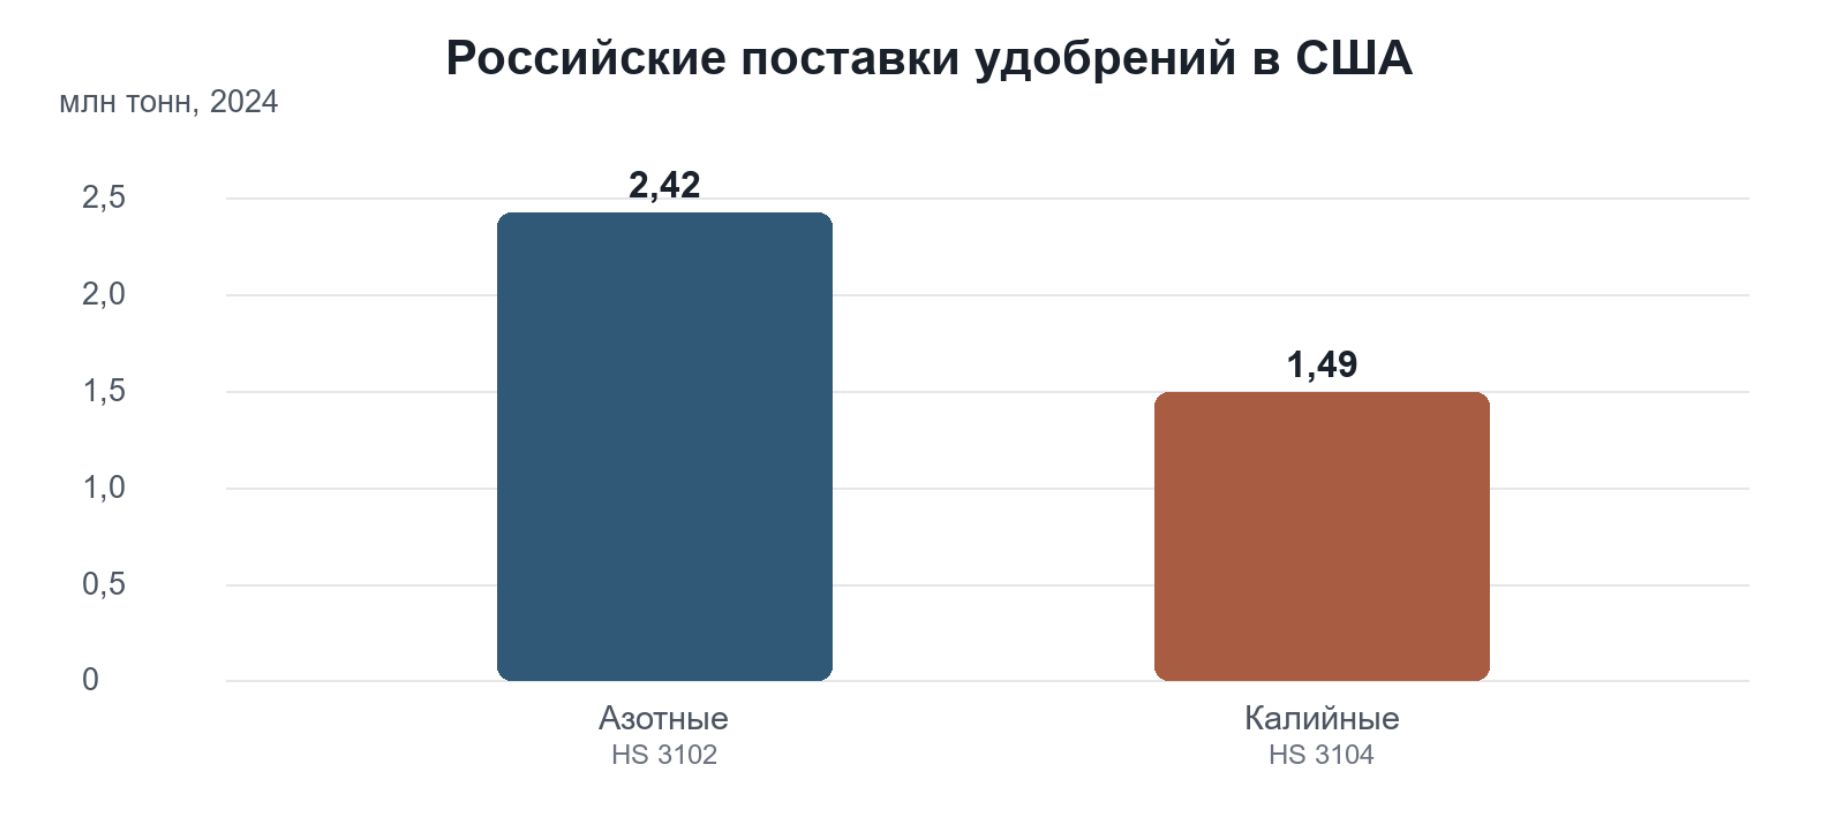
And this is not only about money, but also about very significant physical volumes. In 2024, the United States imported 2.42 million tons of nitrogen fertilizers and 1.49 million tons of potash fertilizers from Russia. Together, that is almost 4 million tons, even without counting phosphorus and mixed fertilizers. Russian products accounted for more than a quarter of U.S. nitrogen fertilizer imports and about a tenth of potash imports.
Chart 3. Russian supplies of nitrogen and potash fertilizers to the United States in 2024 Source: UN Comtrade via WITS, HS 3102 and HS 3104; 2.4199 and 1.48995 billion kg, rounded to 2.42 and 1.49 million tons Scope: physical mass of the two commodity groups for 2024; this is not nutrient equivalent and not the total volume of all fertilizers. Important: the charts have different scopes — monetary value of HS 31, net import dependence by nutrient, and physical mass of HS 3102/3104. Their values are not directly comparable.
The situation with urea is especially interesting. In the first seven months of 2026, the United States imported about 1.49 million tons of this fertilizer from Russia. Russia accounted for 35.4% of U.S. urea imports, making it the largest supplier of this product. Thus, Russian producers have already managed to secure very strong positions in one of the most attractive segments of the American market.
That is precisely why the proposal for a sharp increase in supplies requires some caution in assessment. American farmers will not buy more fertilizer just because presidents agreed to it. Consumption is determined by planted acreage, agricultural technology, crop prices, and the cost of fertilizers themselves. If Russian supplies increase, it will mainly be at the expense of other foreign producers, not because of the emergence of fundamentally new demand.
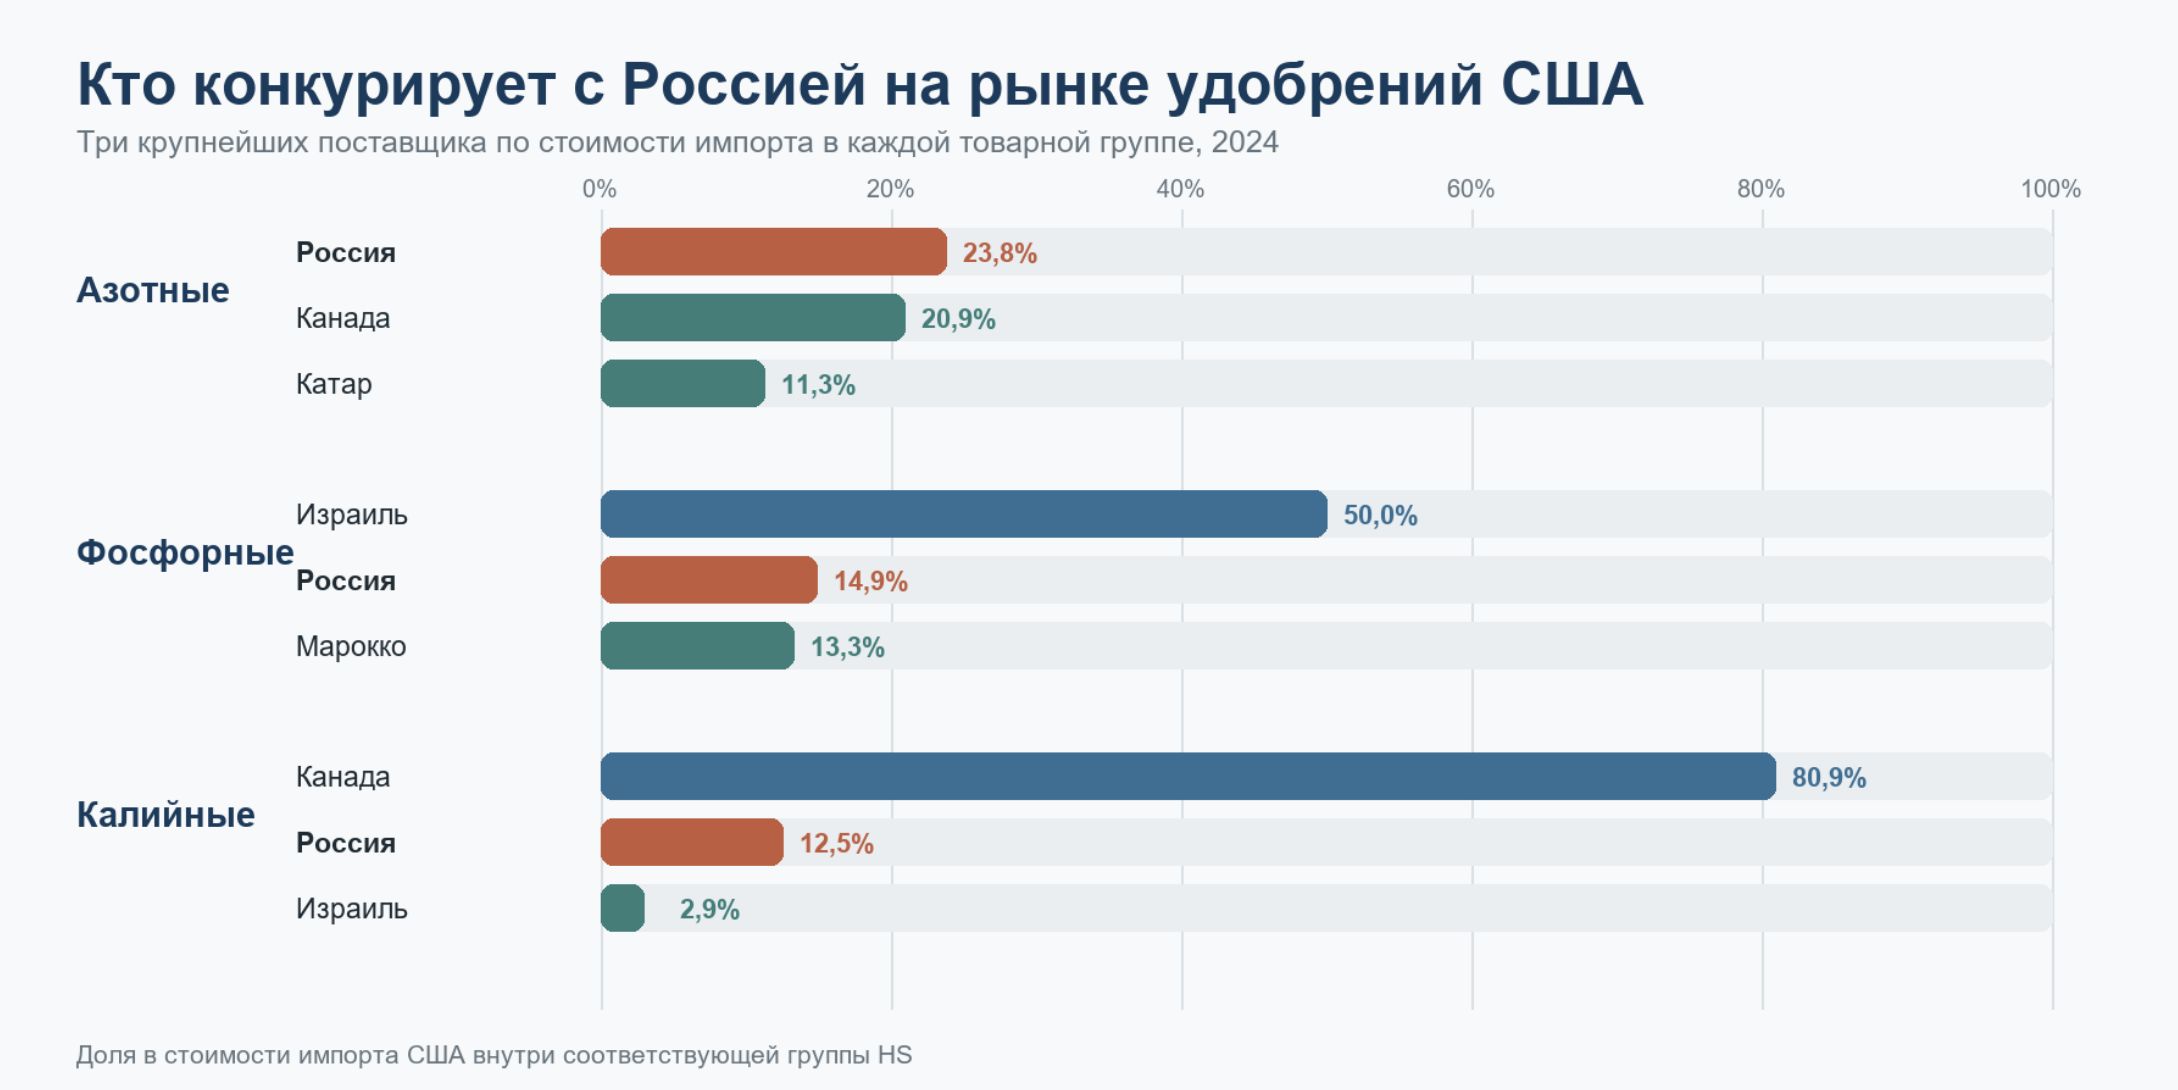
The possibilities for such displacement are also uneven. In the potash market, Russia will have to compete primarily with Canada, whose advantage lies not only in production scale but also in proximity to American consumers. In the nitrogen fertilizer market, competition is with producers from countries that have cheap natural gas. Russian companies have their own advantage thanks to low domestic gas prices, but American producers also have access to relatively cheap raw materials.
Chart 4. Russia’s competitors by fertilizer type in the U.S. market, 2024 Source: UN Comtrade via World Integrated Trade Solution (WITS), U.S. imports, value, 2024. Scope: nitrogen HS 3102, phosphorus HS 3103, potash HS 3104; the three largest suppliers in each group are shown. The data in this chart have a different commodity scope than total HS 31 fertilizer trade and nutrient-dependence indicators.
Even additional supplies of 1 million tons per year at an assumed price of $350 per ton would bring Russian exporters only about $350 million in revenue. That is a noticeable sum for a single company, but relatively small against the backdrop of roughly 45 million tons of total Russian fertilizer exports. At the same time, additional revenue does not necessarily mean additional profit: part of the product would have to be redirected from other markets, and new contracts may require price concessions.
But commercial results are not the only possible goal of negotiations. Russian fertilizers are not under a comprehensive U.S. import ban. Trade continues despite war, sanctions, and political conflict. However, sanctions risks, problems with payments, insurance, and transportation can increase costs and create uncertainty. If agreements reduce these risks, Russian producers will benefit even without a significant increase in physical shipments.
The American side may also be interested in expanding the circle of suppliers. For farmers, this means stronger competition and potentially lower prices, and for Washington, reduced dependence on individual trade partners, above all Canada in the potash market. But here a contradiction arises: the desire to reduce dependence on one supplier may result in increased dependence on another, with whom relations are much less predictable.
For the Kremlin, the benefit looks somewhat different. Russia’s fertilizer industry has become one of the most resilient export sectors since the start of the war. Production and exports continue to grow, and Russian products maintain strong positions on the global market. The opportunity to present further development of this trade as the result of interstate negotiations makes it possible to turn the commercial success of private companies into a political resource.
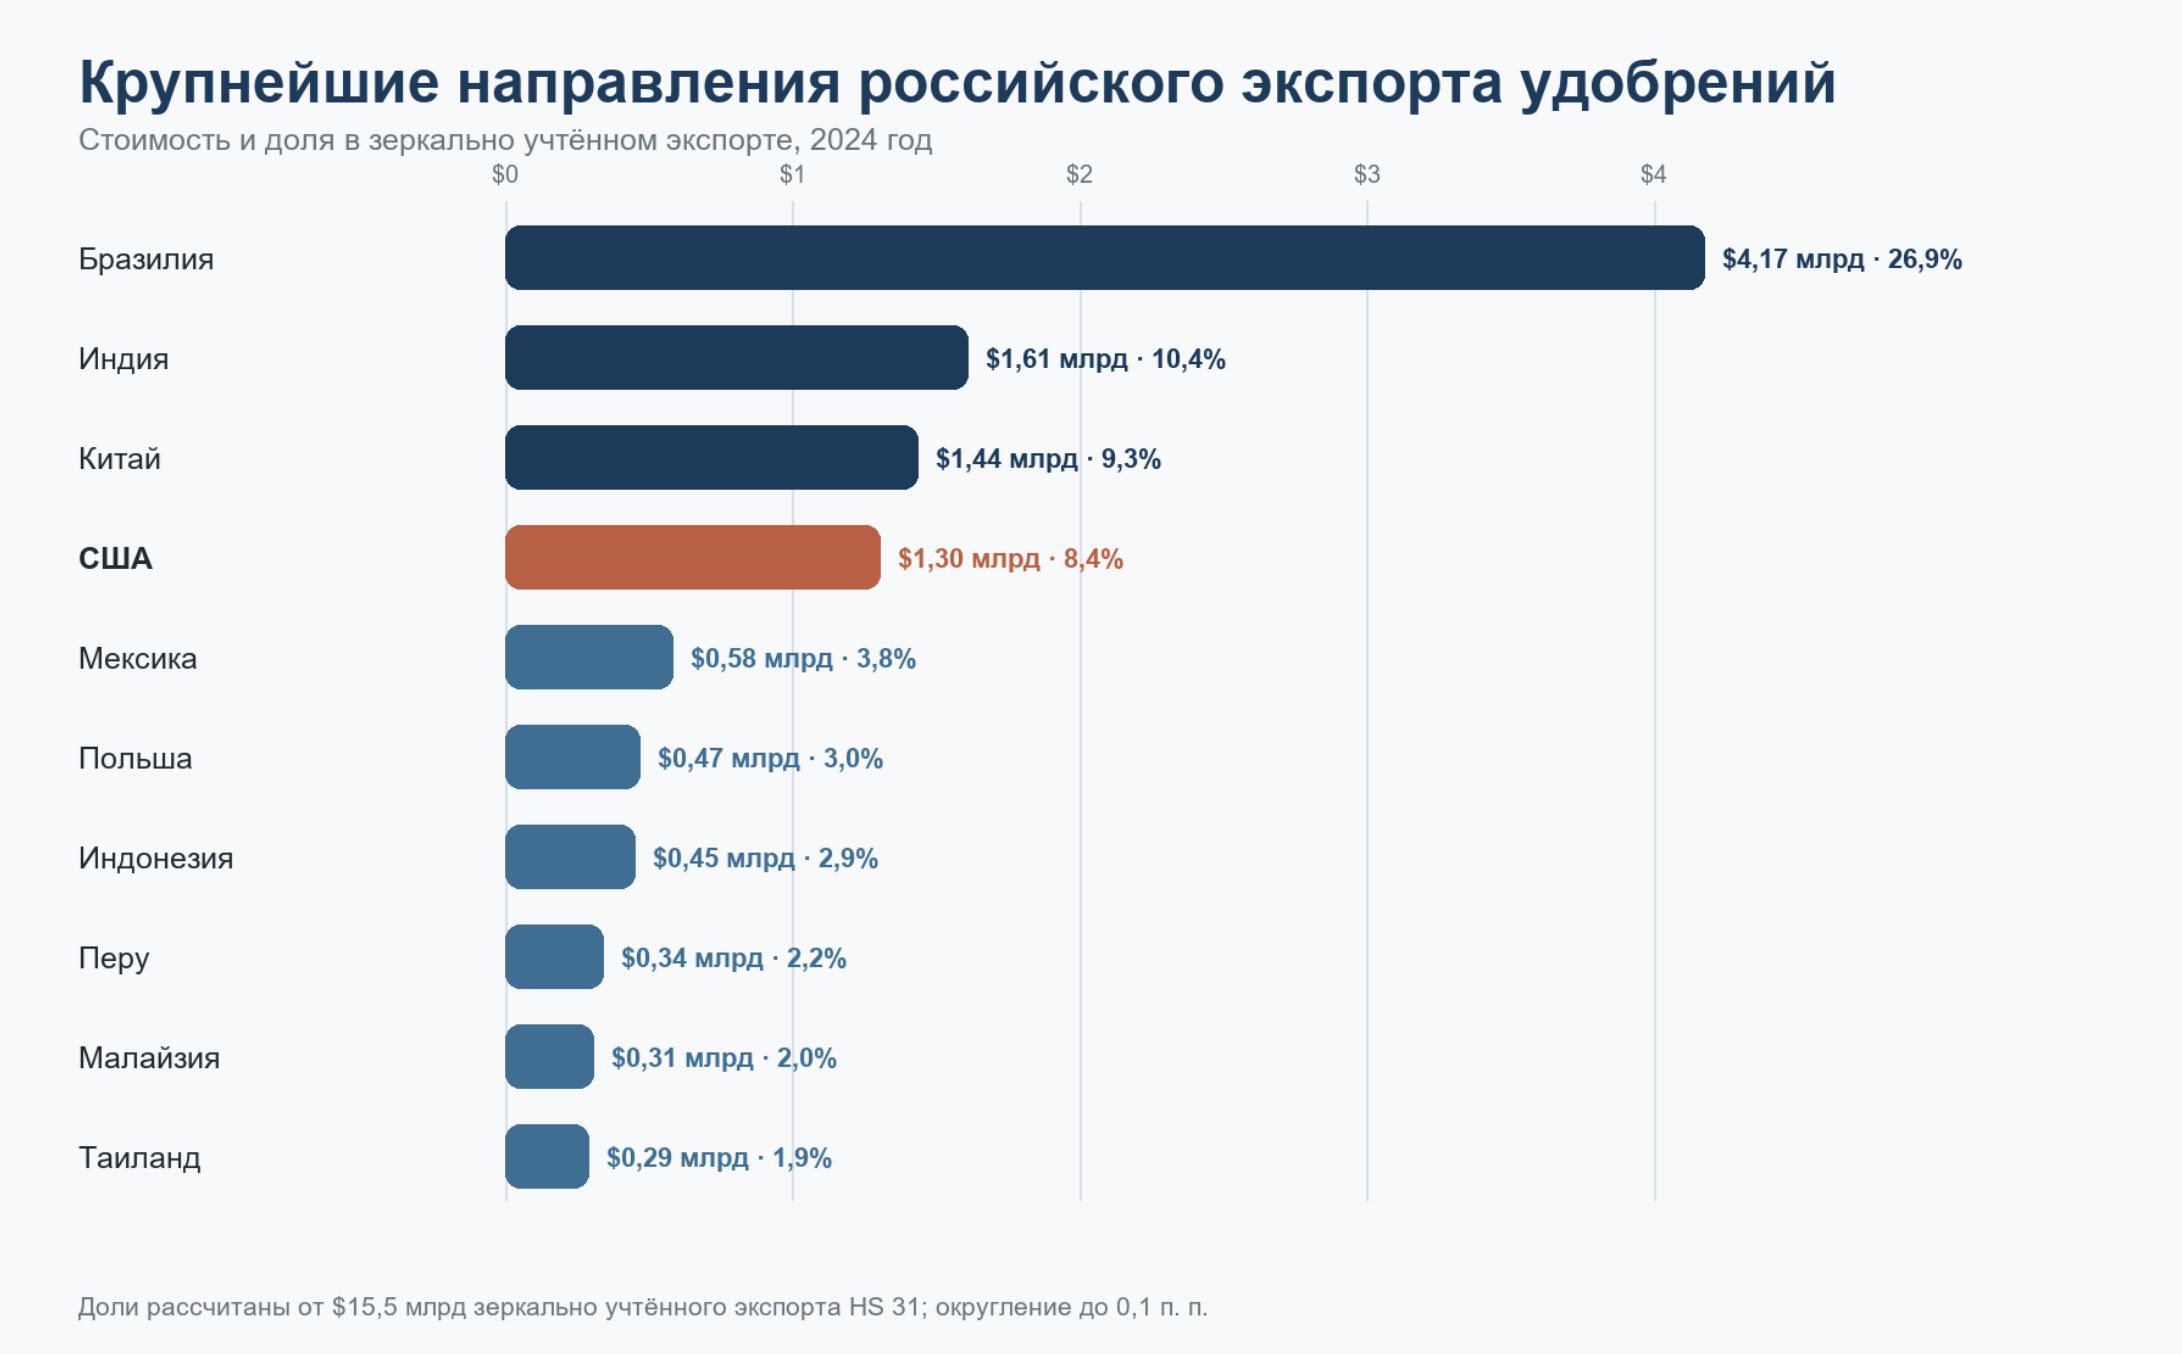
Chart 5. Geography of Russian fertilizer exports by country, 2024 Source: UN Comtrade via World Integrated Trade Solution (WITS), mirror import data of partner countries from Russia, HS 31; total value of Russian fertilizer exports according to UN Comtrade mirror statistics — $15.5 billion. Scope: 2024; the ten largest countries are shown. The EU as an aggregate is not included to avoid double counting member states. Shares are calculated from $15.5 billion and rounded to 0.1 percentage point. The methodology differs from data on physical volumes of individual fertilizer types.
And another question arises here. Russian fertilizer producers are already selling millions of tons of products to American buyers and earning billions of dollars from them. If the American market is open and trade is developing, why is a special political agreement needed at all? And what should Washington give Moscow in exchange for supplies of a product that American companies already buy freely?
Perhaps the real subject of negotiations is not additional millions of tons, but guarantees for the preservation of trade, easing of restrictions, or the creation of exemptions from future sanctions. Then the economic meaning of the deal will be determined not by the volume of new supplies, but by the value of the political commitments the sides exchange.
Russia’s system of relations between the state and fertilizer producers has long been built on a combination of administrative pressure and bargaining. The state determines the conditions for supplies to the domestic market, regulates exports, and claims part of the sector’s rent while leaving companies the opportunity to earn high profits. Now the same mechanism may extend beyond the domestic economy: the Kremlin is trying to control not only the distribution of industry income, but also the political value of its export contracts.
It turns out to be a rather strange deal. Americans are being offered to buy what they are already buying. Russian companies are being promised a market in which they are already operating. And the Kremlin expects to receive a political payment for trade that has been doing just fine without its mediation.
If you enjoyed this article, consider making a donation — one-time or, even better, monthly. Your support helps us motivate our authors and become better with every article.
Our organization is recognized by the Internal Revenue Service (IRS) as a 501(c)(3) tax-exempt, charitable organization, which means that all contributions made to us are tax-deductible to the fullest extent permitted by U.S. law. Individuals may generally deduct charitable contributions of up to 60% of their Adjusted Gross Income (AGI) for cash donations made to qualifying 501(c)(3) organizations. For donations of appreciated assets (such as stocks or other long-term capital assets), the deduction is typically limited to 30% of AGI, based on the fair market value of the asset. C-corporations may deduct charitable contributions of up to 10% of their taxable income for donations made to eligible charitable organizations.
By submitting a donation, you confirm that you have read and accept the following documents: Privacy Policy and User Agreement, and also give consent to the processing of your personal data.
If you would like to unsubscribe from a monthly donation, please email us at: [email protected]